May 01, 2019
Investment Returns on Cropland


What level of return can I get with cropland, and at what risk? Does it go in the bucket for fixed income or equity (stocks)? How does it perform over time? These are some of the questions we ask ourselves when first thinking about this asset class. Most investment advisors are not familiar or comfortable with farmland investing, and we don’t hear many advertisements for it, so it can be hard to know where to turn for advice.
The answers to questions like these are simple at the surface but can get very complicated as we drill down into farmland investing. Let’s just start at the surface today.
Farmland Total Returns
The concept of Total Return combines periodic cash flow with the change in value of the underlying asset. In a stock index, the total return is the dividend plus the price change over a period of time. In bonds, it’s the interest payment plus the price change. Total return calculations often assume that dividends or interest payments are reinvested in the underlying asset.
You can look up agriculture market data at the QuickStats website for the USDA National Agricultural Statistics Service. There, we can find national average cash rents and land values for cropland. Cash rents are the lease payments made by farmers to land owners when the form of lease is not a crop share or other type. Cash rents are typical for many types of rental properties, like apartments and offices, and they are very common with farmland owned by investors. Land owners have expenses that must be paid from cash rents, such as property taxes and any capital improvements they decide to make, but since property taxes are commonly low on agricultural land, many analysts use cash rents as a proxy for the cash flow to land owners.
So, the Total Return to cropland consists of the net rents plus any change in the value of the land. Using 20 years of data from NASS (and cash rents as a proxy), Total Returns look like this nationally:
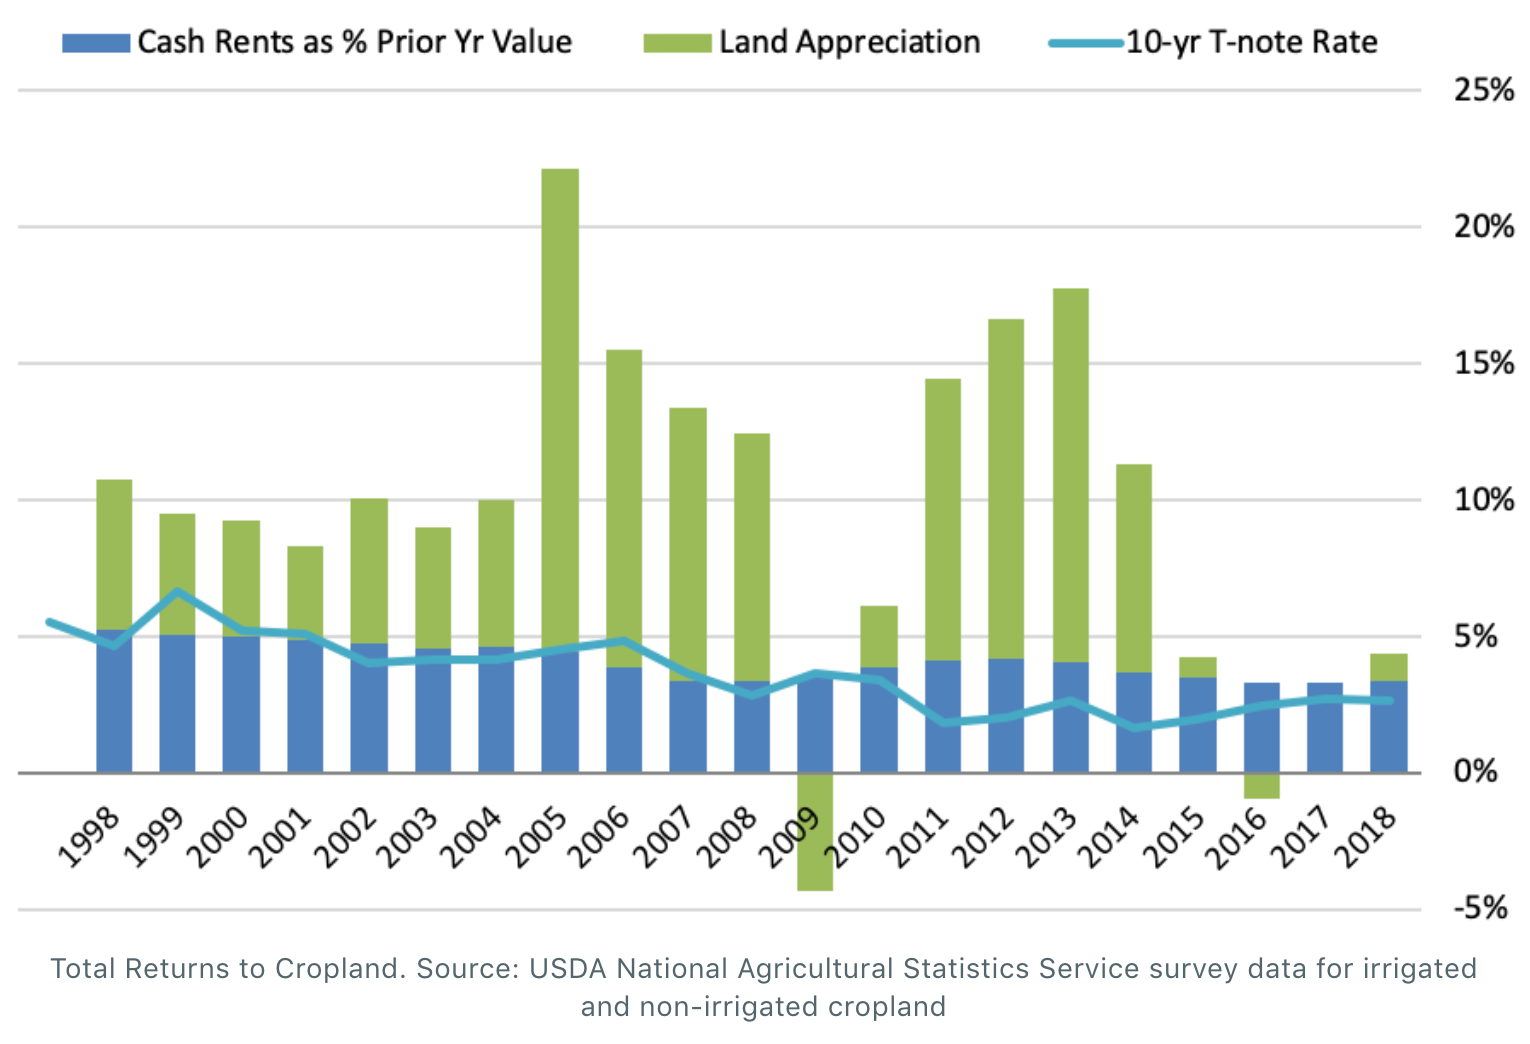
The level of cropland rents, at just over 3% of asset value, is comparable with the dividend yield on blue chip stocks (e.g.: 2.3% on the Dow Jones Industrial Average stocks) and the yield on 10-year Treasury notes (about 2.5% today).
Let’s juxtapose cropland investment against broad equity and fixed income asset classes. The S&P 500 Total Return Index includes dividends (assuming reinvestment). The ICE BofAML US Corporate Bond 7-10 Year Index tracks the total return on investment grade corporate bonds in a maturity range similar to common holding horizons of many land investment classes. I made a Cropland Total Return Index by assuming reinvestment of cash rents into cropland at the NASS average acre value each year, to be consistent with other total return indices. I then normalized each index to a 1998 value of 100.
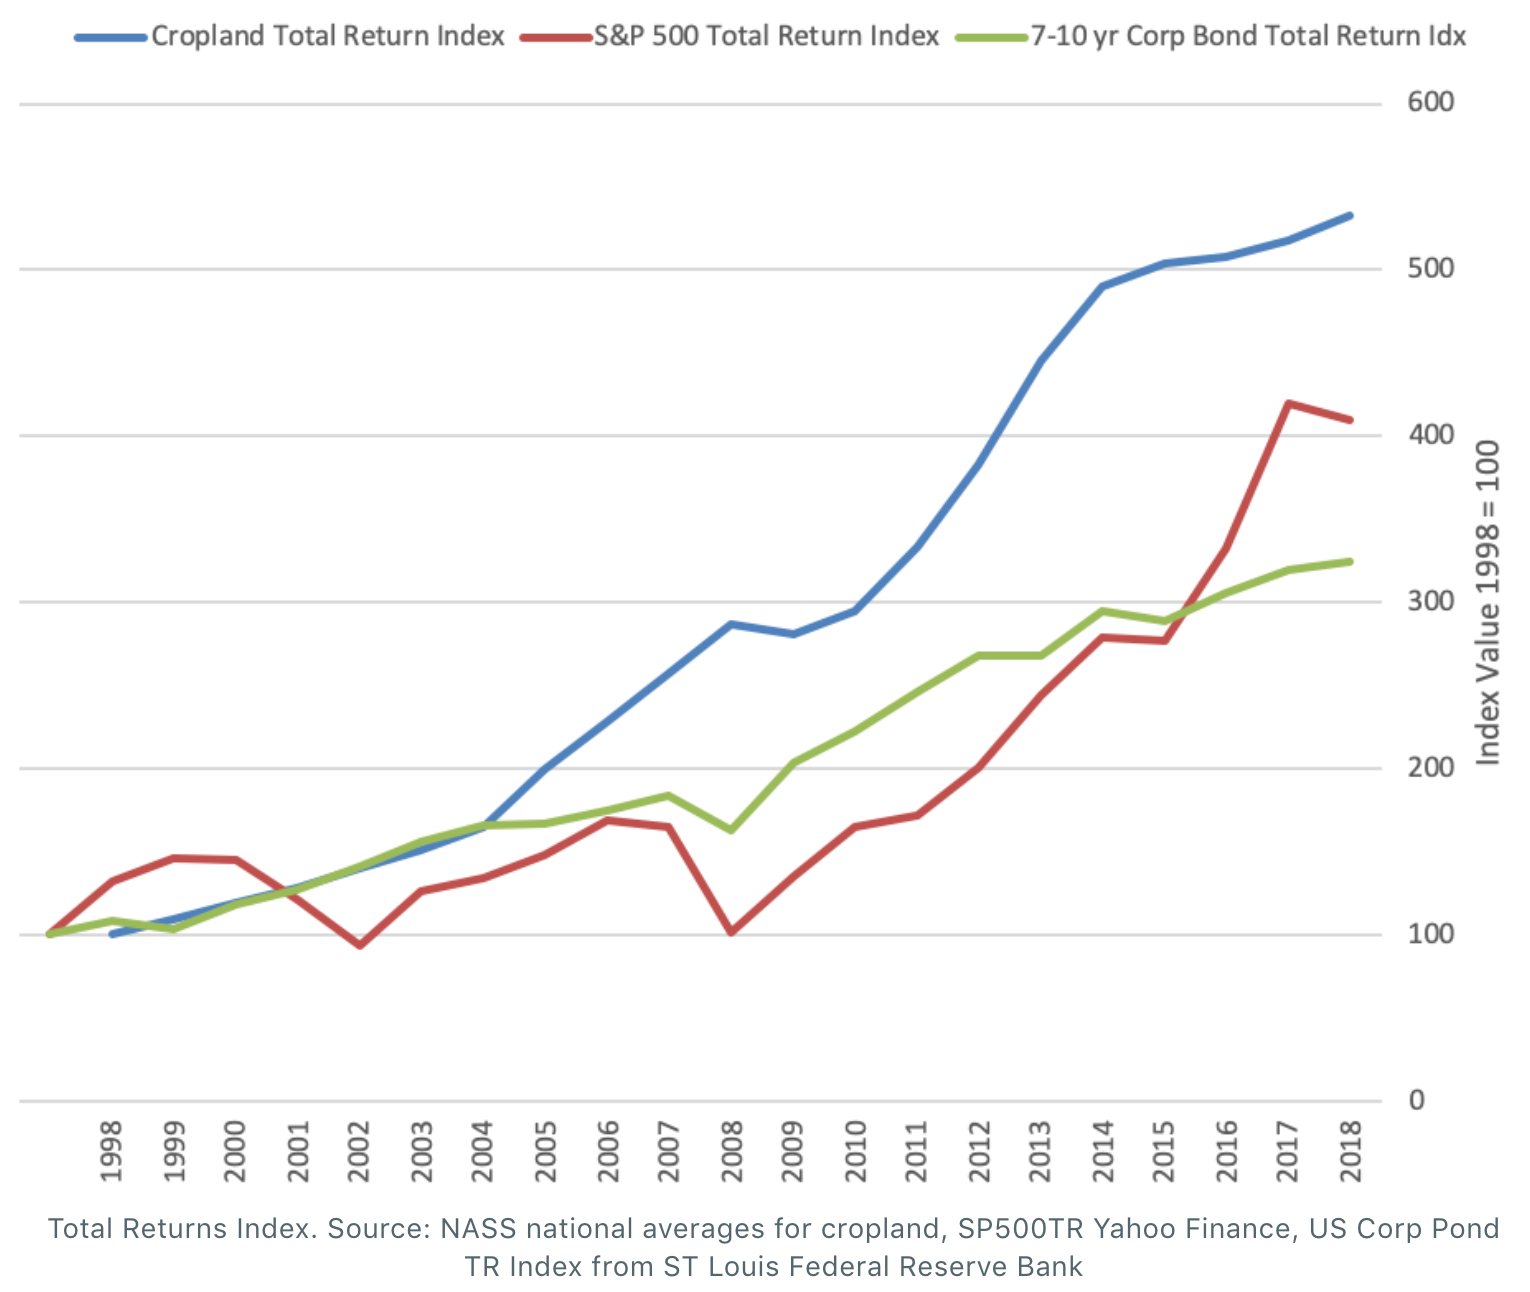
You can see that cropland outperformed the equity and fixed income benchmarks over this period of time. In generally efficient markets the returns are correlated to the risk of the investment. There are two primary measures of risk: credit risk and variability of returns. The credit risk in cash rent leases is minimized by the fact that most such leases call for payment in full before planting. If a tenant can’t pay there can be time to get another tenant, so the risk of default is mitigated (this issue manifests itself in other ways, so stay tuned for later articles about that).
In terms of land value, it is often said that there was no 10-year period where cropland was worth less at the end than at the beginning. It does fluctuate, however. Variability is often measured by the standard deviation of periodic total returns. According to Morningstar, the standard deviation of the S&P 500 Total Return index is about 13.5% over the last 15 years. Calculating the standard deviation of the 7-10 year US Corporate Bond Total Return Index for each January of the last 15 years, it’s 7.6%. The same calculation for NASS cropland total returns is only 6.7%. You can see it in this chart:
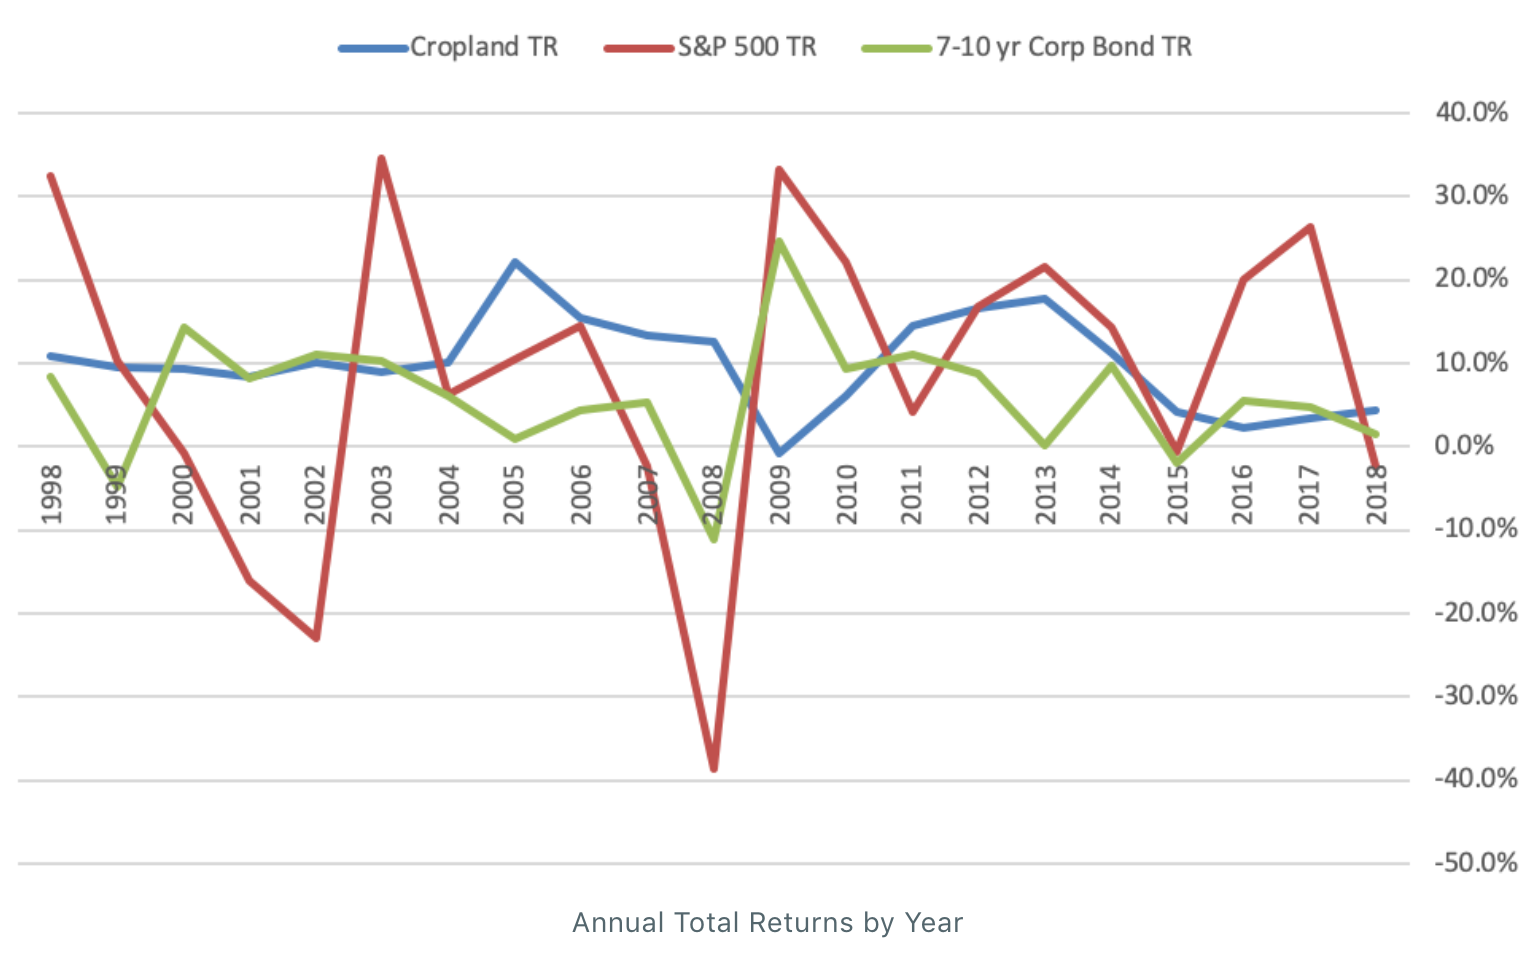
Stock market returns gyrate while the cropland returns have been more stable. That translates as lower risk. Also, note that during periods like the 2001-2002 bear market and the 2008 stock market crash cropland values were holding their own, and during the down period in fixed income from 2009 – 2014 cropland actually boomed in value. Portfolios that were diversified with investments in all 3 asset classes had lower risk overall. That can be especially true during inflationary times. But, keep in mind that land is less liquid than financial assets, meaning that it takes longer to sell. If a land owner needs to convert land to cash quickly there can be price consequences, which can impact the returns realized.
To learn more about the benefits of investing into farmland, see our "Why Farmland?" page.
As always, please consult your financial advisors about all your investment alternatives. Nothing herein is meant to be forward-looking.
Click here to see farmland's historical performance, visit our FAQ to learn more about investing with FarmTogether, or get started today by visiting ways to invest.
Disclaimer: FarmTogether is not a registered broker-dealer, investment advisor or investment manager. FarmTogether does not provide tax, legal or investment advice. This material has been prepared for informational and educational purposes only. You should consult your own tax, legal and investment advisors before engaging in any transaction.
Was this article helpful?