April 27, 2021
Cropland Broken Down By State


When thinking about farming in the United States, and farmland investing in particular, it’s easy to get overwhelmed by the regional differences in risk, production strategy, and crop choice across the country. The Midwest is the corn and soy powerhouse, California is all things produce, and the west raises cattle, right?
The following will break down what is grown in each state by taking a deeper dive to articulate crop products for each state.
Agricultural Regions
To start off, it’s easiest to break up the country by region, before we head to the state level. The U.S. Economic Research Service has articulated 9 agricultural regions that indicate significant differences in the production capacity, crop choices, and supply chains in each region. These can be seen in the map below.
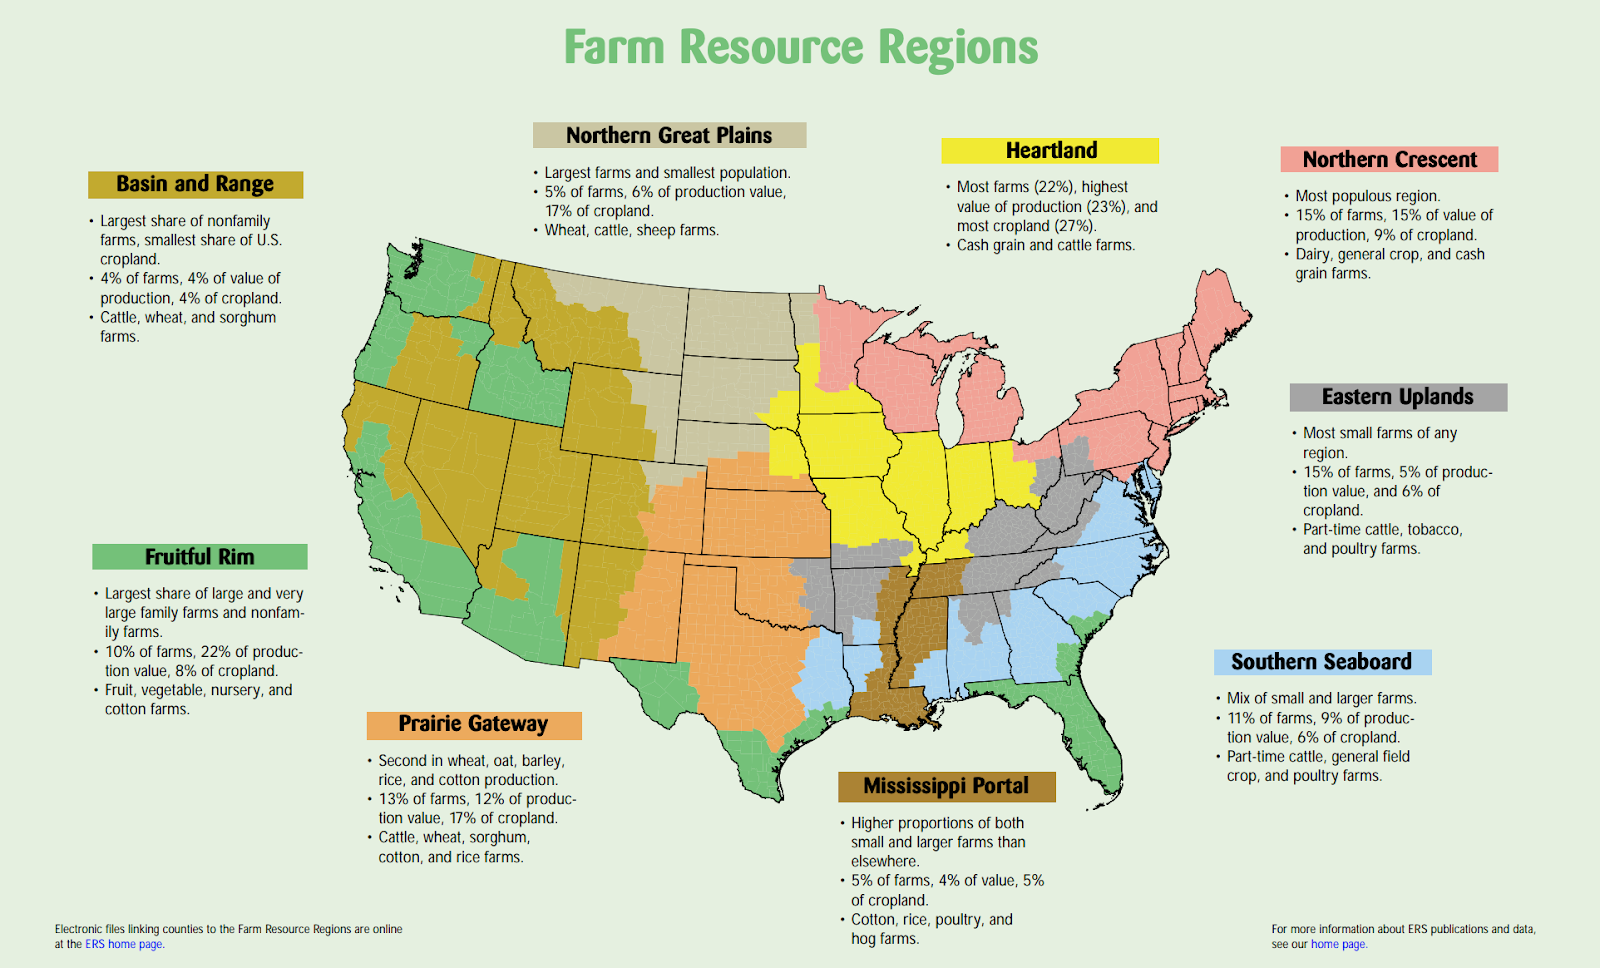
USDA Economic Research Service Farm Resource Regions break up the contiguous U.S. into agricultural regions based on supply chains, production capacity, and climate.
These regions have major differences in their respective agricultural production systems, which can have a dramatic effect on agricultural investment strategy. For instance, agricultural production in the Basin and Range region primarily revolves around cattle and beef production, which is a high risk and typically low return product. However, the agricultural land values are often much higher than their production capacity would indicate and more reflective of ecosystem services and amenities. This means that investing in this region will look dramatically different than the Fruitful Rim.
When thinking about regional differences in farmland investing, it’s important to think about factors that affect supply, like soil type and climate, and factors that affect demand, like the product category and markets. For example, one likely wouldn’t want to invest in someone growing oranges in Montana, as they don’t have the climate or soil for it, nor do they have the supply chains needed to easily get that product to market.
Land use modeling can be a good resource to try and understand how climate change might shift land use capability. One recent publication by Gaurav Arora and colleagues in 2020 articulated that the Northern Great Plains region is likely to shift to grass and wheat production over other cropland uses under climate change scenarios. Other research has articulated that crop rotations and crop mixes are likely to change across the arid west. A watchful eye should be paid to these predictions when thinking about both commodity prices and production potential for each region.
As climate change affects us all, it will be important to be mindful of how these climate shifts are changing these supply side barriers. Maybe it won’t be too long before we are, in fact, growing oranges in Montana.
Crop Mix by State
Now that we generally understand the production regions of the contiguous U.S., let’s dive into what is grown in each state, and see how it has been changing. To do this, we will use the USDA Cropland Data Layer. This dataset lets us harness the power of remote sensing and satellite imagery combined with the National Agricultural Statistics Service’s census data to produce an estimate of the acreages of each crop grown in each state.
What we see, unsurprisingly, is that the midwest, especially Iowa and Illinois have the highest percentage of land in cropland out of any state, and that some states have very little cropland in general, when compared to other land uses. Nevada only has 1% of its total land allocated to crop production.
Importantly, cropping decisions are also a product of the farmers rotation structure. The midwest is known for corn and soy, and one reason that those two crops are grown in the same area is because corn and soy can be rotated in on the same field to help maintain nutrients in the soil. Soybeans are a legume, which take nitrogen from the atmosphere and fixate in the soil. Corn, on the other hand, uses up the nitrogen in the soil. Growing the two crops in a rotation helps maintain balance in the system.
If a farm rotates crops onto their field that complement each other, like corn and soy, it can lead to higher yields with less artificial inputs. Alfalfa, for instance, is a perennial crop that can last nearly 8 years in some areas with one seeding, but you cannot seed alfalfa into old alfalfa, as it emits a neurotoxin that kills its own seedlings. Folks often use a barley or wheat rotation with alfalfa. The push for regenerative agriculture is all about innovative systems that minimize artificial inputs and create balance in an ecosystem. As shown in the current crop choices for each state, regenerative systems will also look different for each region and each state.
Cropland vs. Crop Value
To only look at the acreage allocated to each crop would be to only tell half the story. The other half is how much value is associated with each acre in production. From the interactive map, we see that as far as crop production goes, wheatland and alfalfa/hay are two of the top crops by acreage in nearly every state, but are typically less valuable products by weight than fruits or corn/soy. To better understand the most valuable products by state, we turn to an infographic put together by the folks over at howmuch.net.
The top valued agricultural product for each state. Data come from the USDA and the graphic was made by howmuch.net.
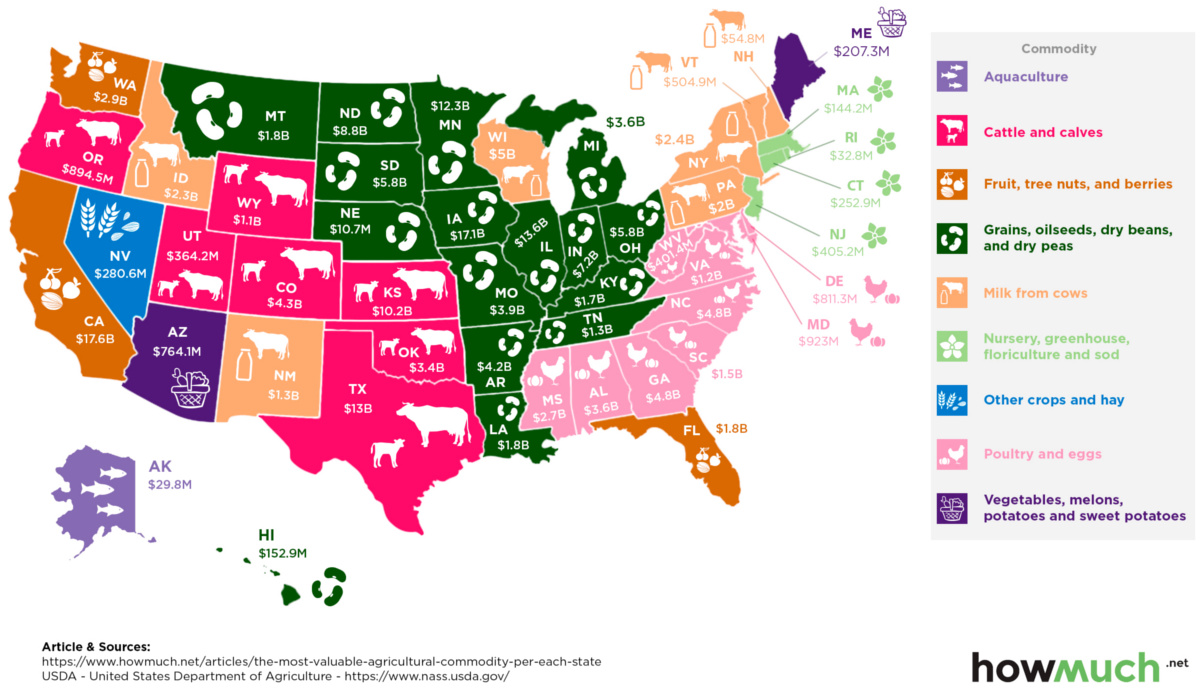
Every state’s agricultural capacity is unique, and this map demonstrates just how dramatically different the value of the top commodities can be for each state. For example, we see that the fruit, nut, and berry industry in California is valued at $17.6 billion. For comparison, that’s roughly the same as the entire Gross Domestic Product (GDP) of Botswana.
Farmland Investing is really a choice to invest in the market of the crop, the production capacity of the land, and the abilities of the farm management team. Each time land, markets, and people come together, it creates a unique story. Each of these stories make the investment into agriculture a unique opportunity to support sustainable food systems, healthy returns, and rural livelihoods.
Click here to see farmland's historical performance, visit our FAQ to learn more about investing with FarmTogether, or get started today by visiting ways to invest.
Disclaimer: FarmTogether is not a registered broker-dealer, investment advisor or investment manager. FarmTogether does not provide tax, legal or investment advice. This material has been prepared for informational and educational purposes only. You should consult your own tax, legal and investment advisors before engaging in any transaction.
Was this article helpful?